Last week, we compared March 2019 sales to March 2020 sales, remembering that 2020 sales could not take into consideration the full effect of our current circumstances. (If you missed it, click here.)
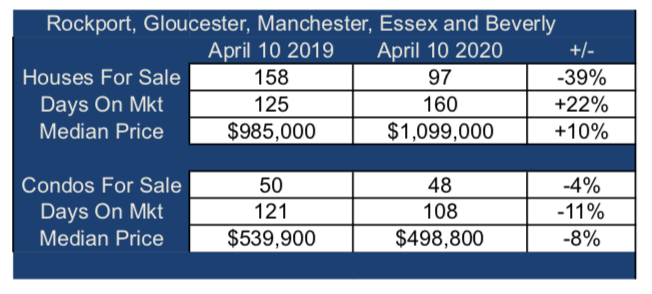
This week, we compare the number of properties that were for sale in the MLS last year on April 10, 2019 to those for sale today, April 10, 2020.
Under typical circumstances, our analysis would be specific to homes in one neighborhood: by town/street/price range/water front/water view etc. But because the current “stay home” circumstances effect us all, we painted broad strokes that include all the activity and price ranges in Rockport, Gloucester, Manchester, Essex and Beverly.
If we weren’t all house-bound, the statistics might indicate:
- “Inventory is down 38%! Seller’s market!”.
- “The median ask price on houses is up 10%! The market is appreciating!”
- “Condo days on market are down 11%. They’re selling quickly!”.
But we are still house-bound…
View original post 111 more words

