Just ahead of today’s forecast
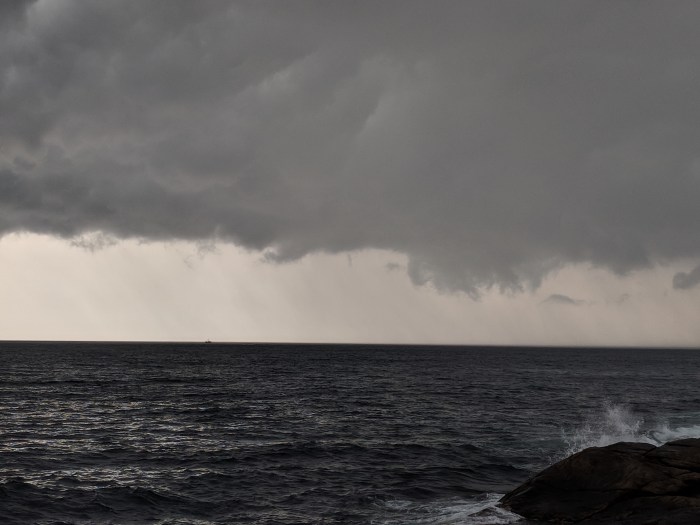
Photo challenge – did you spot the fishing boat? Answer:
click to enlarge (left photo vs marked up photo boat circled on right)

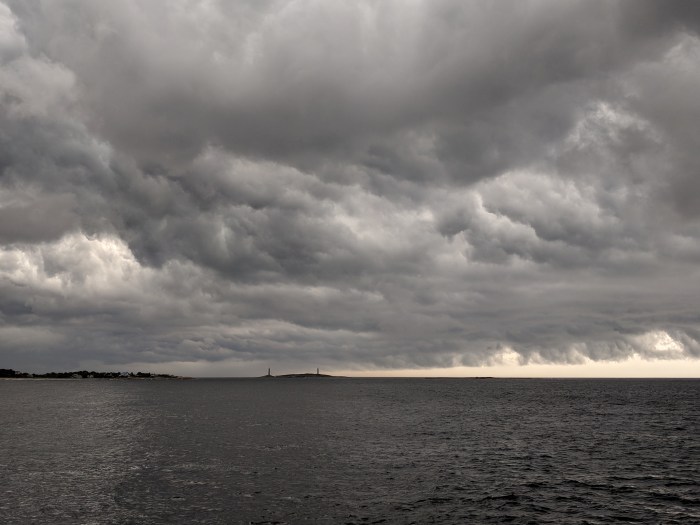
Over Thacher
My View of Life on the Dock
Just ahead of today’s forecast
Photo challenge – did you spot the fishing boat? Answer:
click to enlarge (left photo vs marked up photo boat circled on right)
Over Thacher


Catherine..First photo right on the horizon edge of the storm keen capture it was a biggie. Many times move out if close to shoreline or rocks to prevent getting blow up or rolled up on rocks unless of course you have engine issue then you want to get close to shoreline rather than drift away but still may get grounded. Dave:-) & Kim 🙂
Commercial Fishing: An Industry Overview
https://www.nap.edu/read/1622/chapter/3
The United States—with coastline on two oceans, the Gulf of Mexico, the arctic seas, and the Great Lakes, and its extensive rivers, lakes, and reservoirs —is among the leading fishing nations of the world. Fishery resources within its 200-nautical-mile exclusive economic zone (EEZ) make up about 15 percent of the world’s total. Commercial fishing makes significant contributions to the national and regional economies; in 1989 10.7 billion pounds of fish were landed by U.S. vessels, fifth in total world harvest behind Japan, the Soviet Union, China, and Peru (National Oceanic and Atmospheric Administration [NOAA], 1990a).
The U.S. fishing industry is composed of harvesting, processing, and marketing segments, each with an associated infrastructure. The numbers of Vessels used in this report are estimates based on composite data of widely varying statistical validity and are presented to provide a frame of reference for development and analysis of safety-improvement strategies and alternatives later in this report. About 30,000 fishing industry vessels were documented with the federal government in early 1990 (vessels 5 net tons and over). Table 2-1 depicts the actual number of documented vessels that could be categorized as “fishing industry vessels” on March 31, 1990. The ports in which these vessels are documented do not necessarily reflect the regions where they are employed. For example, a significant number of vessels from the West Coast, and to a lesser degree from the North Atlantic region, are operated in North Pacific and Alaskan waters. Fish processing and fish tender vessels are operated almost exclusively in North Pacific and Alaskan waters (a few operate in the North Atlantic region). An estimated 260 fishing industry vessels have federal
Page 19
Suggested Citation:”2 COMMERCIAL FISHING: AN INDUSTRY OVERVIEW.” National Research Council. 1991. Fishing Vessel Safety: Blueprint for a National Program. Washington, DC: The National Academies Press. doi: 10.17226/1622. ×
Add a note to your bookmark
TABLE 2-1 Documented Self-Propelled Vessels Under 5,000 Gross Tons with a Fisheries Endorsement but not a Passenger or Offshore Supply Vessel on March 31, 1990
Coast Guard Documentation Port
Number of Vessels
Atlantic Coast
Boston, Massachusetts
3,255
New York, New York
950
Philadelphia, Pennsylvania
715
Hampton Roads, Virginia
3,668
Miami, Florida
3,467
Great Lakes
Cleveland, Ohio
155
Gulf Coast
New Orleans, Louisiana
3,264
St. Louis, Missouri
55
Houston, Texas
2,224
West Coast
Long Beach, California
974
San Francisco, California
1,945
Portland, Oregon
1,522
Seattle, Washington
2,835
Alaska
Juneau, Alaska
4,335
Hawaii/Southwest Pacific
Honolulu, Hawaii
305
Total
29,669
SOURCE: Data recorded in U.S. Coast Guard Marine Safety Information System by Coast Guard Headquarters, Washington, D.C., on March 31,1990. or state permits to process (e.g., freeze or can) fish. Of these, about 210 have both harvesting and processing capabilities. A documented vessel’s actual use in the fishing industry is not monitored by Coast Guard automated information systems or data bases.
In 1987, the latest year for which broad-based industry data are available regionally, it is estimated that about 31,000 federally documented fishing industry vessels and 80,000 smaller craft were registered with the coastal states (with the Coast Guard in Alaska) and bearing state numbers (Table 2-2). These
Page 20
Suggested Citation:”2 COMMERCIAL FISHING: AN INDUSTRY OVERVIEW.” National Research Council. 1991. Fishing Vessel Safety: Blueprint for a National Program. Washington, DC: The National Academies Press. doi: 10.17226/1622. ×
Add a note to your bookmark
TABLE 2-2 Estimated Number of Fishing Industry Vessels Active During 1987 by Region Fished1
Region
Documented Vessels
State-Numbered Vessels
North Atlantic
New England
1,800
16,500
Mid-Atlantic
800
5,500
Chesapeake Bay
2,500
3,500+2
South Atlantic
2,700
13,500
Gulf/Caribbean
Gulf Coast
10,000
26,5003
Caribbean
4
1,500
Great Lakes
5
5
West Coast
5,000
6,000
Alaska
8,000
9,000
Hawaii/Southwest Pacific
200
200
Total
31,000+/−
80,000+/−6
1Numbers are composite estimates from regional sources. Principal sources include records of fish landings maintained by National Marine Fisheries Service regional offices, permit data maintained by the Commercial Fishing Entry Commission in Juneau, Alaska, and regional assessments commissioned for this study, and economic analyses available for some fisheries.
2Based on 1986 estimate of Chesapeake Bay oyster fishery (Sutinen, 1986).
3Includes a large number of small boats engaged in shrimp fisheries in bays, sounds, and estuaries.
4Negligible.
5Current information is not available.
6The number of commercial fishing vessels bearing state numbers is not known. West Coast and Alaska figures are close approximations. All other data presented are general estimates.
LikeLike