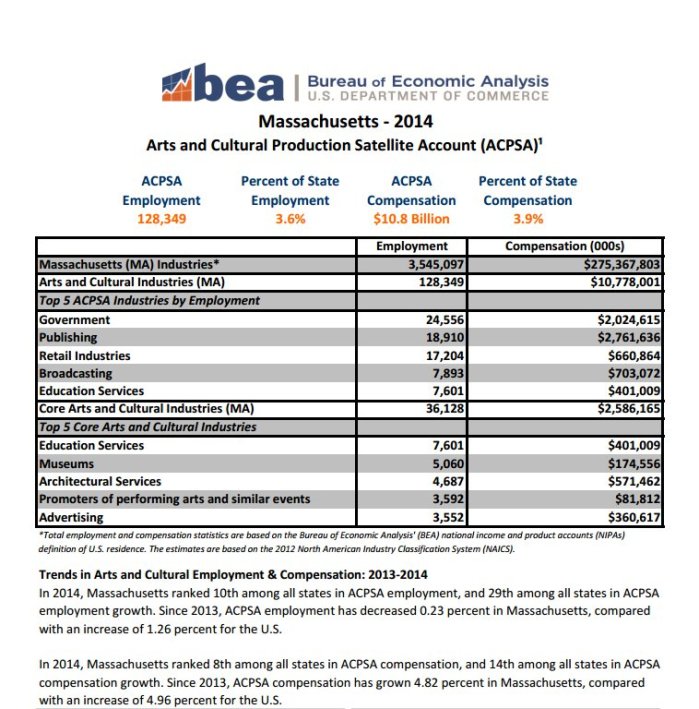
In 2014, the Massachusetts labor force was 3,570,000 (vs 3,626,800 in February 2017 ); and the North Shore accounted for 6.3%. Yesterday, the US Dept of Commerce Bureau of Economics announced the state by state breakdown of arts and culture employment –for the first time ever– based on the 2014 national data. MA arts and culture jobs were reported to be 128,350, and 3.6% total MA labor. Various reports overlap categories. Sometimes “Health and education” are packed together or “arts, entertainment, recreation and leisure”. In MA top industries such as Financial services (20%), Technology, Medicine and Life Sciences, Manufacturing, Fishing, and Tourism (125,000–note how similar in size this is to the arts and culture jobs) are discussed.
Massachusetts Work Force and Labor Area Review (2015). pp44-45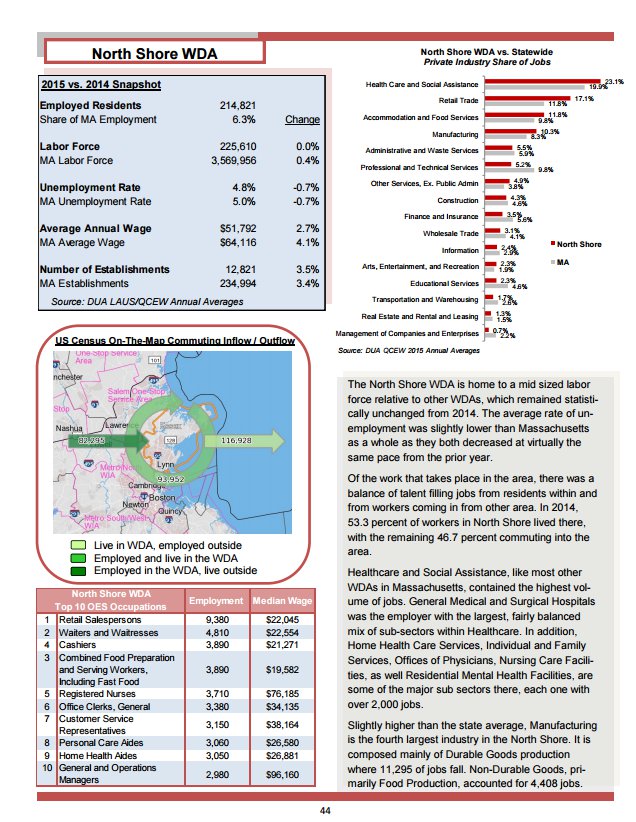
US Dept of Commerce Bureau of Economic Analysis reports the following MA stats: “The states with the highest concentration of arts and cultural jobs, with their location quotients: New York (1.47), Wyoming (1.30), Washington (1.28), California and Utah (both 1.17), Rhode Island and Colorado (1.13), Alaska (1.11), Massachusetts and Oregon (both 1.09)…The Location Quotient (LQ) is a measure of an industry’s concentration in a state or region relative to the industry’s national concentration. • As for compensation, in 2014 Massachusetts and NEFA had an LQ of 1.02 and 0.94 respectively. • In 2014, Massachusetts had a location quotient of 1.09 for ACPSA employment. In Massachusetts, therefore, ACPSA employment was 9 percent above the national average. By comparison, the LQ for arts-and-cultural employment in all states belonging to the U.S. regional arts organization NEFA (of which MA is a member) was 1.03 or 3 percent above the national average.


One thought on “Of the 226,000 North Shore jobs, how many do you think arts and culture?”